-
10 Customer Service Metrics You Should Be Measuring
Tue, 25 Jul 2017, in Reporting
Liking this post? You might also enjoy How to Collaborate Better: The Case for a Team Help Desk

Great customer service doesn’t just occur by itself. It occurs when you’re listening and taking notes. When you know what needs to change. Otherwise, how can you change for the better?
Merely going through the motions with your help desk software won’t guarantee certain results you may have in mind. You need the right data and the right process in helping you set specific goals. For example, if you’re trying to make customers happier, you might be inclined to improve the time it takes to resolve customer requests. If you’re trying to reduce complaints, you need to understand who’s complaining about what first.
Read More: What Is Help Desk Software Anyway? Helpdesk Explained
What is the purpose of reporting?
The idea isn’t about being aware of what’s going on in your help desk. It’s about setting and reaching customer service goals. Reports are something that turns lofty ideas into attainable reality.
What’s more, reports help you visualize processes and behaviors that lead to specific outcomes. Yet what you choose to communicate and and how matters quite a bit. For example:
- Frontline agents may want to stay informed (in a private manner, ie email) regarding their own performance relative to the team.
- The team needs to be aware of monthly reports relative to previous periods. Useful for communicating goals for the next quarter. This could be presented in an internal docs site or wiki.
- Management needs to understand key changes in trends. They should be able to set general expectations and establish policies to help reach projections.
In either case, understanding who you must report to and why you’re doing it will help you focus on the right data. Having perspective on all three levels is a must, as is a willingness to improve support operations.
What makes a metric usable?
A while ago, we wrote a popular blog post about treating feedback like a mirror. In it we asked ourselves, “What is feedback supposed to be like?” The words that came to mind were: Descriptive. Specific. Immediate. Genuine. Things that make any type of data reliable and usable.
Similarly, customer service is a precise activity with plenty to measure. There’s call volumes, chat times, resolution rates to decipher. Since it’s much easier to record, measure and analyze quantitative data, we can make calculated decisions that improve productivity as well as the overall customer service experience.
With all this data comes a lot of responsibility. Indeed, deciding on what’s worth keeping (analyzing) and what to dismiss as background noise can be quite a challenge. With this in mind, we came up with a number of customer service metrics you should be keeping an eye on.
1. Customer satisfaction
While you may solve tickets efficiently and on time, you’ve got no idea how well you’re really doing. That’s because one of the more important pieces of information is what customers think of their support experience.
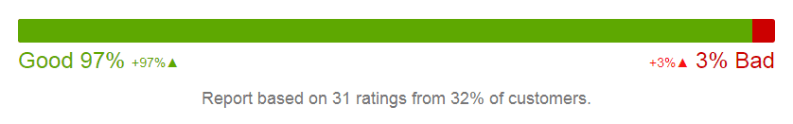
Furthermore, if you can’t place happy customers against those that are unhappy, how do you know where you need to improve?
In Helprace, you can add a simple question at the end of emails that let customers rate their experience with a click of a link. Not only this allows agents to drill down into individual tickets, they can dig deeper and spot trends in:
- customer satisfaction over time
- satisfied vs. unsatisfied customer
- customer satisfaction by team member
2. Conversations per agent
Tracking the number of conversations every team member handles can assist you in managing and assigning workloads. It helps in corresponding agent duties with existing workloads to keep the team functioning at its best.
Having said that, there are many reasons someone might drop below their benchmark. First of all, there might be complex tickets that need extra attention. If you decide to use this metric as a KPI, use it to get the conversation started – not as a measuring stick.
3. Response times according to customer
Obviously, a lower response time will always be a pleasant surprise for your customers. Yet this metric does more than ensure everyone gets a timely answer to their questions.
It’s particularly useful if you’re segmenting customers according to value. Aside from keeping you in the loop of your team’s performance, response times ensure you don’t fall short of expectations with your most valuable customers.
4. New conversations
Paying attention to the volume of inquiries that land in your help desk is crucial. Keeping an eye on spikes during specific times of day (especially over longer periods of time) will help you anticipate crunch times.
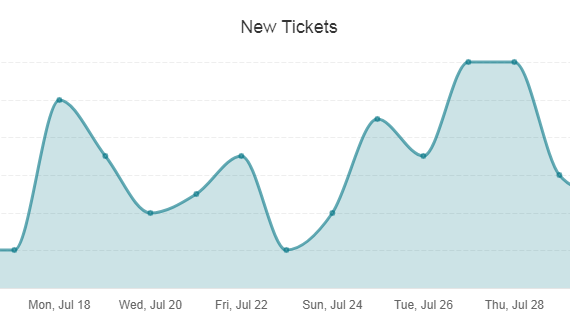
This is not only helpful during the holiday rush, but super handy for planning vacations or working disruptions into your schedule.
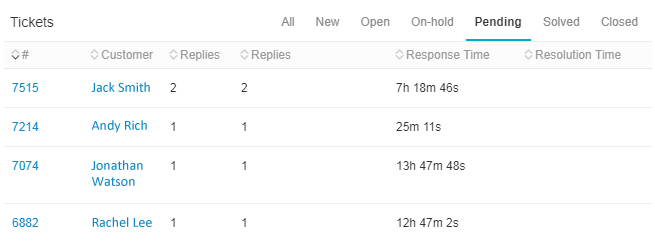
5. One customer’s tickets
Sometimes you need to zero in on one particular customer’s history. This is useful when you’re trying to understand specific customer or agent behavior.
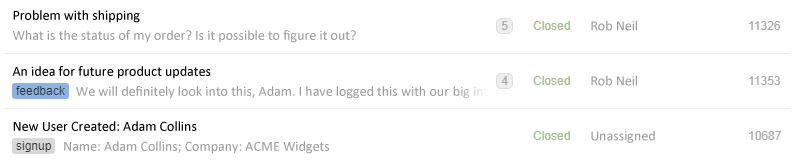
Is this customer a typical or a special case? Getting a snapshot of each customer’s ticket queue (and its assignees) helps you visualize which agents are spending the most time with that customer.
6. Change in ticket quantity
Ticket numbers fluctuate, be it week to week, month to month or year to year. Keep an eye on these trends to be sure you’re going in the right direction.
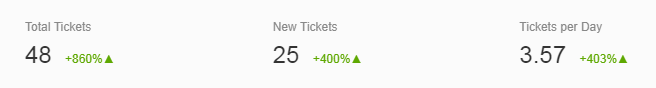
For example, the majority of b2b and b2c businesses out there experience a considerable drop in tickets during the months of December and July. Setting business hours makes issue tracking easier and disregards your evenings & weekends so that you can better compare workday trends.
7. Most used workflow
Being customer-centric means setting goals to stay ahead of customer expectations. As a result, it’s a good idea to review workflows such as saved replies, SLA or automations to help eliminate trouble areas.
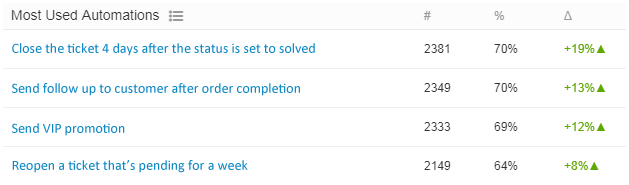
When a certain command or task is used much more than others, it may be a sign of many things. It could be a bottleneck, an overused function (needs to be split into smaller functions) or just a useful shortcut from your team’s point of view.
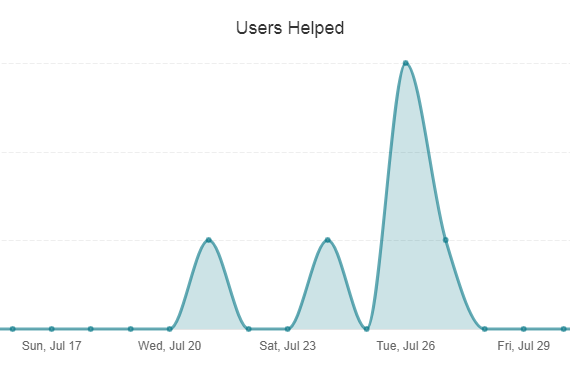
8. Overall support volume
Is there a particularly large boom in tickets at a certain time period? Knowing when your crunch times are (and your ability to handle them) keeps unforeseen disruptions to a minimum.
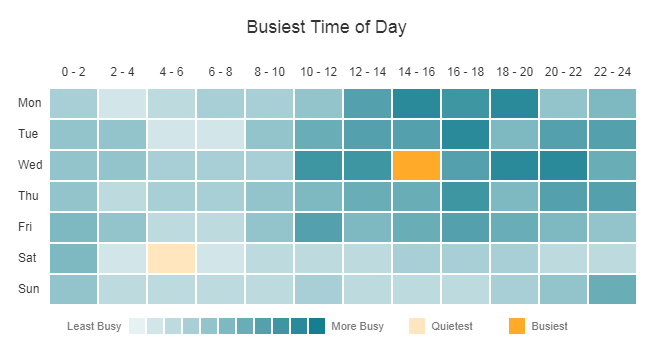
One big advantage of getting a weekly picture over a time period is that it helps you understand what time of day is the busiest – and if there is a reason for that.
9. Problem resolution time
How long should the customer wait until their issue is resolved? Regardless of your answer, making it the primary target for agent performance isn’t always recommended.
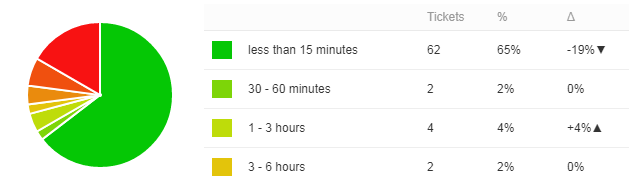
In this sense, the average problem resolution time can tell only half of the story, while the number of emails within that time period will tell you if tickets are directed to the right person (and if that person is adequately skilled in resolving that issue).
- How much back-and-forth communication needed to solve a ticket?
- How soon is a ticket assigned to an agent after it comes in?
- How is the importance of the issue communicated?
- How long does it take for customers to respond?
10. Whether customers find the answer
As your company grows, you’ll need revisit your knowledge base, for both your customers and employees. This goes beyond offering a simple FAQ system – instead, a knowledge base is a self-service machine that answers contextual questions and gives users accurate suggestions.
What should you measure?
Not every company is the same. You may want to focus on a combination of metrics, including whether customers found your knowledge base articles useful or not useful; what article gets the most views and what topics are the most engaging for your users.
What’s in it for you?
Reports don’t just help agents do a better job or offer better service to customers. It’s something that helps the bottom line. It keeps team members on board and sets a trajectory for improvement. It uncovers weak points that otherwise would be hidden from your workflows.
Read More: How Growth Hackers See Growth Differently
Tags: reporting


